
Sydney Airbnb revenue by bedroom ranges from about $108 to $247 per available night across one- to three-bedroom homes in a professionally managed Sydney portfolio.
Three-bedroom homes generate the highest revenue per available night at about $247, with 55% of nights booked and an average nightly rate of $449. Two-bedroom homes record the highest forward occupancy at 65.4%, with an average nightly rate of $247. One-bedroom homes are 64.1% booked at an average rate of $168, with forward occupancy up 2.4 percentage points on last year.
These figures cover forward bookings for the next 60 days and compare performance with the same point last year. Revenue figures represent gross accommodation revenue before management fees and operating costs, so they should not be read as net income or investment return.
L’Abode Accommodation, a luxury property management and holiday rentals specialist offering Airbnb property management in Sydney, analysed the data to help buyers and owners compare how different property sizes are performing.
Sydney Airbnb Revenue by Bedroom at a Glance
Among one- to three-bedroom homes, revenue per available night increases with bedroom count. One- and two-bedroom homes have the highest reported forward occupancy, while three-bedroom homes generate the highest revenue per available night.
| Bedrooms | Nights booked, next 60 days | Change on last year | Average nightly rate | Rate change on last year | Revenue per available night |
|---|---|---|---|---|---|
| 1 | 64.1% | Up 2.4 percentage points | $168 | Not available | About $108 |
| 2 | 65.4% | Up 4 percentage points | $247 | Down about 10% | About $162 |
| 3 | 55% | Up 7.6 percentage points | $449 | Up 18% | About $247 |
| 4 | Not available | Up 8.1 percentage points | $595 | Down about 3% | Not available |
Source: forward booking data from a professionally managed Sydney portfolio, covering the next 60 days against the same point last year. Figures are rounded. Sample sizes by bedroom count are not published.
Four-bedroom homes are included for average nightly rate and year-on-year occupancy movement, but current occupancy and revenue per available night were not available. They therefore cannot be ranked directly against one- to three-bedroom homes on revenue performance.
Revenue per available night is calculated by multiplying the share of nights booked by the average nightly rate. It allows properties with different combinations of occupancy and pricing to be compared on the same basis.
These are forward bookings, so the 60-day window will continue to fill as stay dates approach. The figures represent premium professionally managed homes and should be treated as a portfolio benchmark rather than a market-wide average.
How Each Bedroom Count Is Performing in 2026
All four bedroom sizes have stronger forward occupancy than at the same point last year. Of the three sizes with a reported year-on-year rate change, three-bedroom homes are the only group where both occupancy and average nightly rate increased.
One-Bedroom Homes: 64.1% Booked at $168 a Night
One-bedroom homes have 64.1% of nights booked over the next 60 days, at an average nightly rate of $168. Forward occupancy is up 2.4 percentage points on last year, the smallest increase among the four bedroom sizes.
Revenue per available night is about $108, the lowest among one- to three-bedroom homes. The relatively small year-on-year movement reflects this 60-day window only and does not establish whether one-bedroom homes are consistently more stable over time.
Two-Bedroom Homes: Highest Forward Occupancy at 65.4%
Two-bedroom homes have the highest forward occupancy in the portfolio, with 65.4% of nights booked over the next 60 days. Occupancy is up 4 percentage points on last year, while the average nightly rate has fallen about 10% to $247.
Revenue per available night is about $162. The result shows more nights booked than at the same point last year, but at a lower average rate. The data shows these two movements occurring together; it does not establish why rates changed.
Three-Bedroom Homes: $449 a Night, Up 18% on Last Year
Three-bedroom homes combine 55% forward occupancy with an average nightly rate of $449. Occupancy is up 7.6 percentage points on last year, while the average rate has increased 18%.
Among the three bedroom sizes with a reported rate change, three-bedroom homes are the only group where both occupancy and rate increased. Revenue per available night is about $247, the highest among one- to three-bedroom homes and roughly 1.5 times the two-bedroom figure.
Four-Bedroom Homes: Highest Nightly Rate at $595
Four-bedroom homes have the highest average nightly rate in the comparison at $595, although the rate is down about 3% year on year. Forward occupancy is up 8.1 percentage points, the largest year-on-year gain among the four bedroom sizes.
Current occupancy and revenue per available night were not available for four-bedroom homes, so they cannot be directly ranked against one- to three-bedroom homes on revenue performance.
Six-bedroom-plus homes are a weak spot in the current forward window, including within the managed portfolio, with some segments showing very low occupancy over the next two months. The available data does not establish whether this weakness is temporary or structural.
How the Portfolio Compares With the Sydney Market
The portfolio figures come from premium managed homes, while the wider Sydney market is weighted towards small homes.
One- and Two-Bedroom Homes Make Up 65% of Listings
One and two-bedroom homes account for about 65% of Greater Sydney’s roughly 34,000 holiday rental listings, according to KeyData’s 2026 supply data.
| Bedrooms | Listings (approx.) | Share |
|---|---|---|
| 1 | 13,300 | 39% |
| 2 | 8,900 | 26% |
| 3 | 5,000 | 15% |
| 4 | Not available | Not available |
| 5 or more | 1,600 | Under 5% |
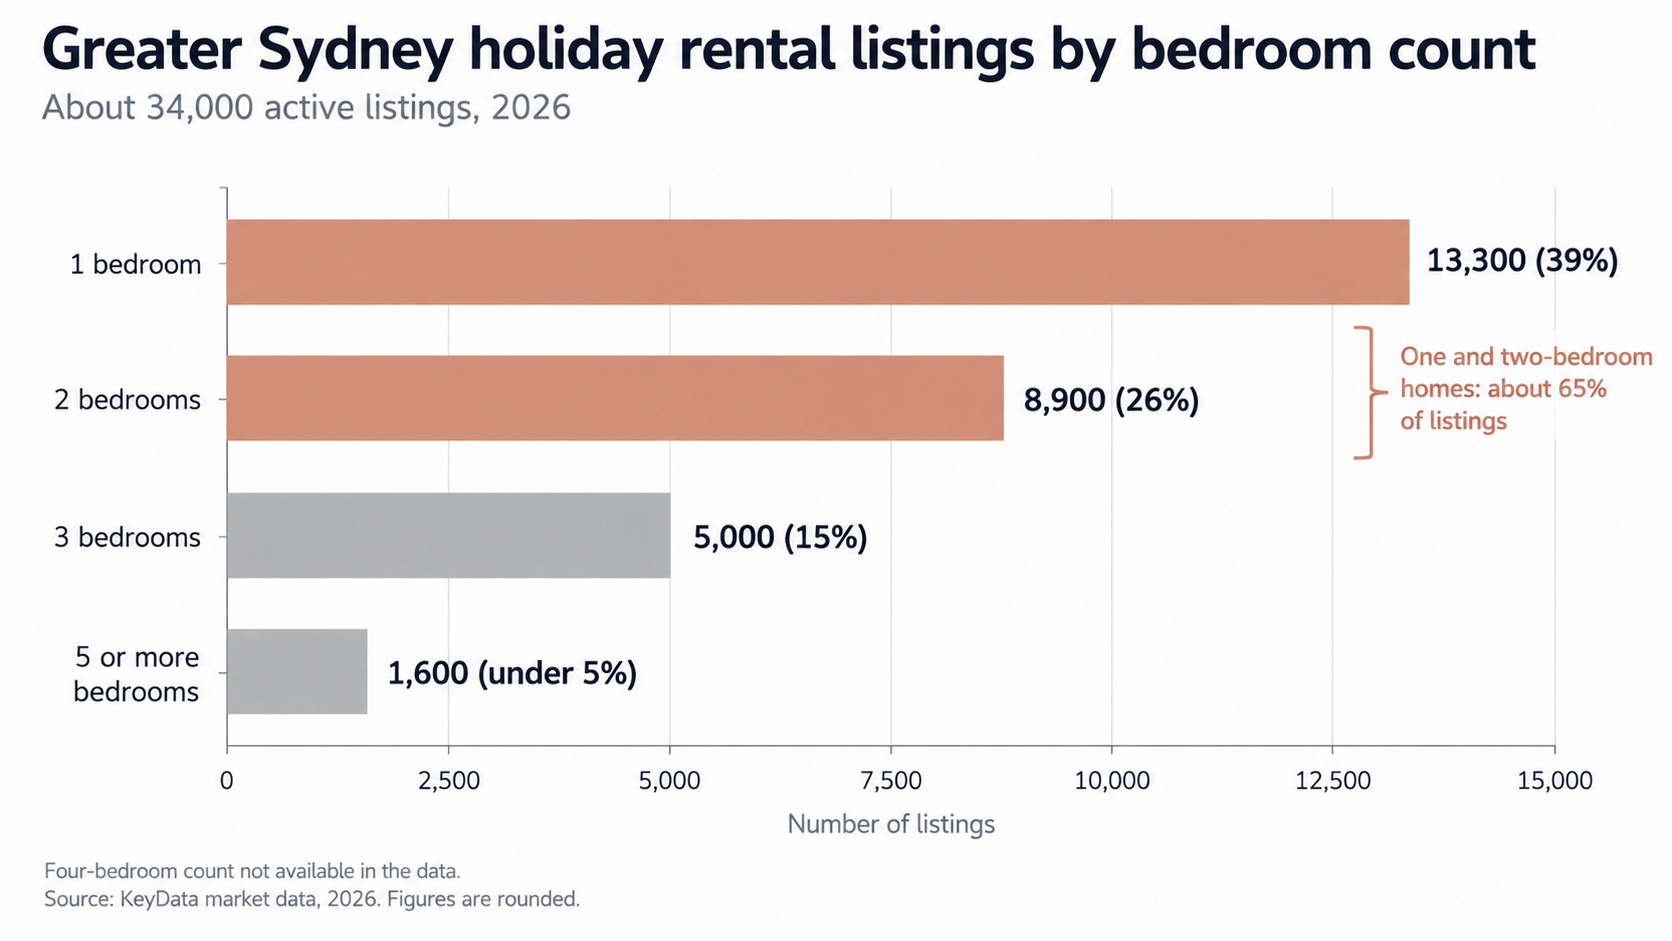 Source: KeyData market data, 2026. Figures are rounded. The four-bedroom count was not in the data supplied.
KeyData counts about 13,300 one-bedroom listings across Greater Sydney, compared with about 5,000 three-bedroom listings. Actual competition varies by suburb, positioning, amenities and price.
Citywide Averages Hide the Bedroom Split
Public market reports usually provide one occupancy figure across all property sizes, which can hide meaningful differences by bedroom count. The portfolio data here allows one-, two- and three-bedroom homes to be compared on forward occupancy, nightly rate and revenue per available night. It should be treated as a benchmark for premium managed homes rather than a Greater Sydney market average.
What the 60-Day Booking Pace Would Mean Over a Full Year
The figures below annualise the current 60-day spring booking pace for illustration only. Sydney’s seasonal booking pattern means the same pace should not be expected to continue for a full 12 months. If the current pace held year-round, a one-bedroom home would imply about $39,000 in gross annual revenue and a three-bedroom about $90,000, excluding operating costs and the 180-day cap.
For context, BNBCalc’s current trailing-12-month Sydney dataset reports average annual revenue of about A$ 47K for 1BR, A$ 74K for 2BR, A$90K for 3BR and A$ 107K for 4+BR Listings. Those figures use a different dataset and should not be treated as directly comparable with L’Abode Accommodation’s 60-day forward portfolio.
Illustrative Run-Rates From a 60-Day Spring Window
Each run-rate is based on current revenue per available night multiplied across 365 days.
| Bedrooms | Run-rate if the current pace held all year | Booked nights that implies | Reference: 180 nights at the current rate |
|---|---|---|---|
| 1 | About $39,000 | About 234 | About $30,200 |
| 2 | About $59,000 | About 239 | About $44,500 |
| 3 | About $90,000 | About 201 | About $80,800 |
| 4 | Not available | Not available | About $107,100 |
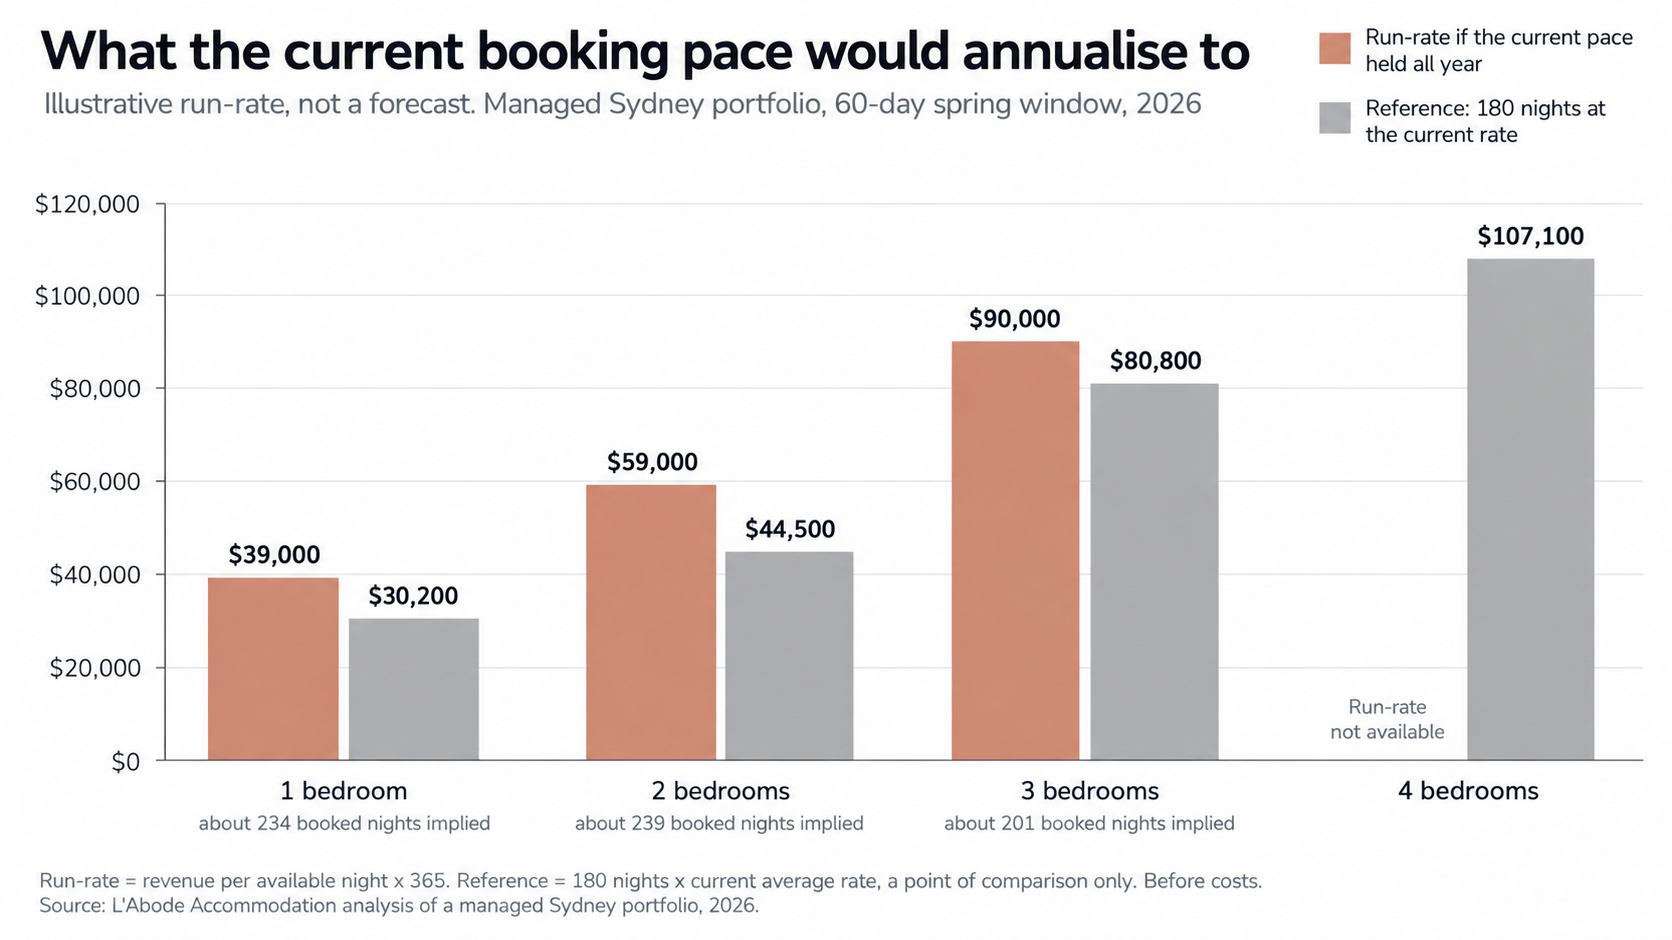 The 180-night column shows what gross accommodation revenue would look like if a property achieved 180 booked nights at its current average nightly rate. It is a reference point only, not an expected result. Seasonality is one reason the annualised figures should be treated cautiously. AirROI reports average Sydney occupancy of 54.2% across the peak months of December, January and March, compared with 36.3% from May to July.
Actual performance will also vary by location, property quality, pricing, availability and management.
How the 180-day Cap Applies to These Run-Rates
Under NSW Planning rules, non-hosted short-term rental accommodation in Greater Sydney is limited to 180 days within each 12-month registration period. Hosted stays are not subject to the same cap, while bookings of 21 consecutive days or more do not count towards the 180-day limit.
The illustrative run-rates above imply about 201 to 239 occupied nights for one- to three-bedroom homes if the current 60-day pace continued throughout the year. For a non-hosted property subject to the cap, reaching those occupancy levels would require some stays to fall outside the nights counted towards the limit, such as qualifying stays of 21 consecutive days or more.
The practical impact varies by property because registration periods and booking mixes differ. L’Abode Accommodation, for example, operates a hybrid model that combines short-, mid- and longer-term furnished stays. L’Abode Accommodation’s guide to the 180-day cap on short-term rentals in NSW explains how the rule applies in more detail.
Revenue Is Not Return: Add Costs and Purchase Price
The figures in this article represent gross accommodation revenue, not investment return. Platform fees, management, cleaning, utilities, insurance, tax and other operating costs all reduce the amount an owner ultimately receives.
Purchase price matters as well, and the portfolio data does not include acquisition costs. Airbtics grades Sydney C for short-term rental investability and places it in the lowest 15% nationally for yield in its March 2026 data. Its broader research also reports relatively low gross rental yields for two- and three-bedroom properties, although individual results vary substantially by market, purchase price and operating costs. Revenue per available night per bedroom is about $108 for 1BR homes, $81 for 2BR homes and $82 for 3BR homes.
Which Bedroom Count Suits Your Goals?
Bedroom count alone cannot decide which home suits an owner. Suburb, the quality of the home, purchase price and costs are not in this data, so the table below is a benchmark, not a recommendation.
| If your priority is | Relevant portfolio signal | What the data does not show |
|---|---|---|
| Higher forward occupancy | 2BR leads at 65.4% | Net profit or whether this continues long term |
| Higher revenue per available night | 3BR leads 1–3BR at about $247 | Purchase price, costs and investment return |
| Lower nightly-rate price point | 1BR averages $168 | Purchase price or total ownership cost |
| Higher nightly-rate potential | 4BR averages $595 | Current occupancy and RevPAN |
| Assessing larger homes | 6BR+ is currently soft | Whether the weakness is temporary or structural |
Sydney Airbnb revenue varies significantly by bedroom count, but higher nightly rates do not automatically mean stronger overall performance.
In L’Abode Accommodation’s current 60-day portfolio data, two-bedroom homes lead on forward occupancy at 65.4%, while three-bedroom homes generate the highest revenue per available night among one- to three-bedroom properties at about $247. Four-bedroom homes command the highest average nightly rate at $595, although current occupancy data is not available for a direct revenue comparison.
For owners and buyers, bedroom count should be treated as one part of the decision. Purchase price, operating costs, suburb, seasonality, booking restrictions and the 180-night cap can all materially affect the final return.
Book a rental appraisal with L’Abode Accommodation to assess the earning potential of a specific Sydney property.
FAQs about Sydney Airbnb Revenue by Bedroom
Do larger homes always earn more on Airbnb in Sydney?
No. Larger homes can achieve higher nightly rates, but that does not automatically mean higher occupancy or better investment returns.
In the current portfolio data, three-bedroom homes generate the highest revenue per available night among one- to three-bedroom properties. Six-bedroom-plus homes, meanwhile, are a softer segment in the current forward booking window.
Does the 180-day cap apply if I live on the property?
No. In Greater Sydney, the 180-day limit applies only to non-hosted short-term rental accommodation. If the host lives on the premises while guests are staying, the stay is classed as hosted and has no day limit. This includes renting out a granny flat on the same property where the owner lives.
Units in a building with only an onsite manager or concierge are generally treated as non-hosted. For non-hosted properties, the limit is counted within each 12-month registration period, and bookings of 21 consecutive days or more do not count towards it.
Can strata by-laws stop an Airbnb in a Sydney apartment?
Yes. NSW strata rules can allow an owners corporation to prohibit short-term rental accommodation where the property is not the host’s principal place of residence.
Owners considering an apartment should check the building’s current strata by-laws before relying on short-term rental income.
Which months earn the most for Sydney holiday rentals?
AirROI’s Sydney data for the 12 months to July 2026 identifies December as the strongest revenue month and July as the weakest. December stays also have a longer booking lead time, at about 85 days on average.
Seasonality is one reason a 60-day spring booking window should not be treated as a full-year revenue forecast.